Some new features were Introduced with LumenVox version 12.0, which allow users to monitor the performance of the system, as well as the processes running on the system.
By monitoring these performance metrics over time, engineers can use this information to determine whether the machine is having problems, such as being overloaded, or even project when a system is likely to run out of disk space or another resource which may require maintenance. This information may also be useful to LumenVox customer support staff when diagnosing problems, or tuning system performance.
System Performance
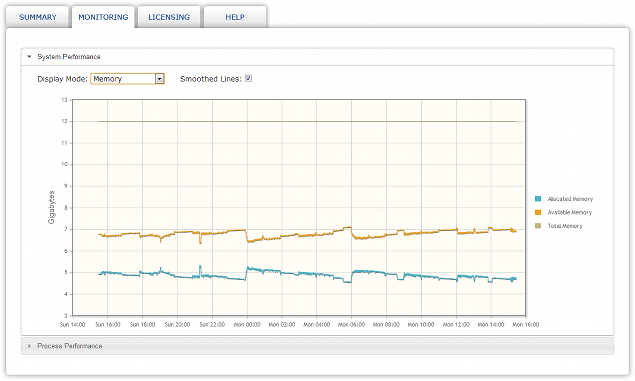
By monitoring various readings from the host server, the Manager application is able to record and track various performance metrics over time. These can be displayed in the Dashboard by selecting the Monitoring tab as shown below:

When viewing System Performance, you can select which resources to view from the drop-down list. Available options are Memory, Disk Space and CPU Utilization, which will display a history of resource use (used and available) for the selected option for the past 24 hours (assuming data has been collected during that period).
Normally, the graphs are displayed with smoothing enabled to allow users to get a feel for the average use for a given period, since a snapshot it taken generally once per minute for resources being monitored. To disable smoothing to highlight the actual data points, simply uncheck the Smoothed Lines checkbox.
Note that you can temporarily toggle a series trace on any of the System or Process graphs by clicking on the corresponding name in the legend. Clicking it again will cause the trace to reappear. Since the chart will be automatically update every 60 seconds, any hidden traces will be shown again when the graph is refreshed.
Process Performance
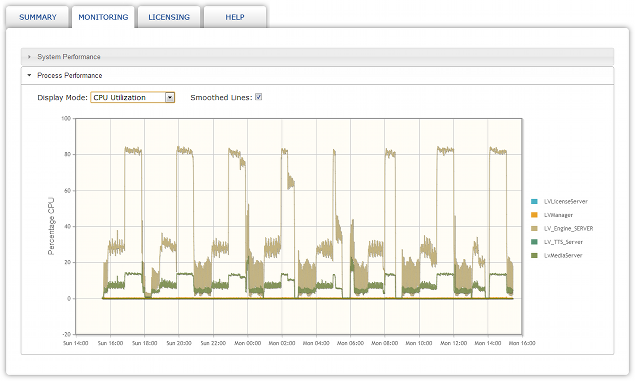
In addition to monitoring the health of the system, the LumenVox manager can also track resource use by process too by clicking on the Process Performance horizontal grey bar.

The list of processes that were detected during the monitoring period are shown as series in the legend to the right.
By default all LumenVox processes are monitored, however users can optionally add their own processes to the list being monitored by editing the PROCESS_MONITOR_LIST option in the manager.conf settings file. Multiple processes can be monitored by providing a comma-separated list, and you may also use the * wildcard, to monitor things like lv*, Lv* or LV* (to track LumenVox processes). The interval used when logging resources can also be changed from the default 60 seconds by changing RESOURCE_LOG_INTERVAL in the manager.conf file too, however we would recommend using the default unless you have a good reason to change this.
When viewing Process Performance, you can select which resources to view from the drop-down list. Available options are Virtual Memory, Resident Memory, Thread Count, Handle Count and CPU Utilization, which will display a history of resource use (used and available) per monitored process, for the selected option for the past 24 hours (assuming data has been collected during that period).
If you move your mouse pointer over any of the plot points on any of the System or Process charts, the date/time and value for the corresponding point will be displayed in a small window that appears next to the mouse pointer.