| |
| |
Reading Logs with the Dashboard
| Reference Number: AA-01744 Views: 11358 |
0 Rating/ Voters
|
 |
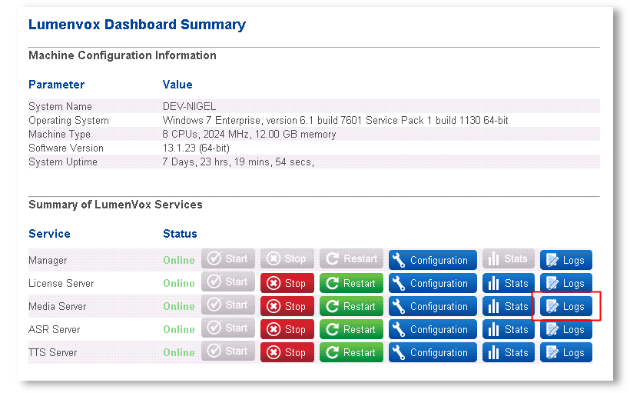
The LumenVox Dashboard can be used to read logs associated with a LumenVox service. To access this feature, login to the main Dashboard click the Logs button for the appropriate service:
This will bring up the Logs view for that service:
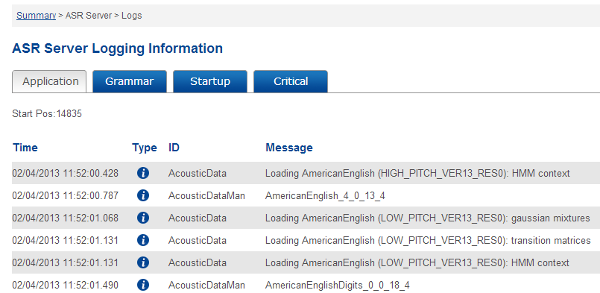
You can use the tabs at the top of the Logs view to toggle between individual logs. The available logs will vary based on the service. For instance, the LumenVox ASR (shown above) has a Grammar log that other services do not have.
The logs view displays the following information:
- Time: The timestamp for the log message, displayed in the American format of MM/DD/YYYY HH:MM:SS.MS.
- Type: The type of message being logged. Types include Info, Debug, Warning, and Error.
- ID: An internal ID representing the element logging the message.
- Message: The actual log message.
Note that not all logs are available through this interface. In particular, some logs associated with LumenVox client processes (such as the Media Server or the Tuner) may not be visible through this interface.
|
| |
|