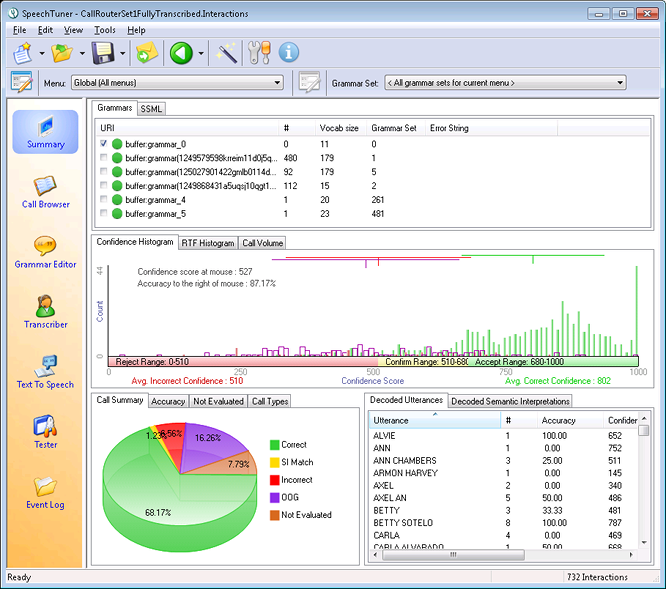
The Summary screen is the main Tuner screen. It will be displayed upon first launching the Tuner and can be accessed at any time by clicking the Summary button in the left-hand navigation bar. It is broken into several areas that provide snapshot views about your data.

Grammars
This area (in the top portion of the screen) displays a list of grammars used in the currently loaded call data. For each grammar, you can see its URI, the number of times it is referenced by interactions, the vocabulary size (the total number of unique words in the grammar), and any errors associated with it.
Double-clicking on one of these entries will open the corresponding grammar document in the Grammar Editor view.
Right-clicking on a grammar from the list brings up a context menu with the following options:
Edit Grammar
Opens the grammar in the Grammar Editor.
Keep Selection
Filters out all interactions that do not use this grammar.
Exclude Selection
Filters out all interactions that use this grammar.
Save Data to File...
Allows you to save the list of grammars to a file.
Properties
Displays advanced information about the grammar, including error strings and debug information.
SSML
Beside the Grammars list is a tab to show a list of the SSML documents that were used to perform syntheses within the application for the currently loaded data.
Double-clicking on one of these entries will open the corresponding document up in the TTS Editor view.
Right-clicking on the SSML list brings up a context menu with the following options:
Edit SSML
Opens the selected SSML document in the TTS Editor.
Keep Selection
Filters out all interactions that do not use this SSML document.
Exclude Selection
Filters out all interactions that use this SSML document.
Save Data to File...
Allows you to save the list of SSML documents to a file.
Properties
Displays advanced information about the SSML document, including any related error or warning messages associated with it.
Confidence Histogram
The Confidence Histogram graph displays information about utterances and their confidence scores. In particular, it shows:
- Correct utterances, displayed as green bars.
- Incorrect utterances, displayed as red bars.
- Out-of-grammar utterances, displayed as purple bars.
- Out-of-coverage utterances, displayed as blue bars.

The height of a bar represents frequency, and along the horizontal axis (X-axis) results are plotted with lower confidence scores at the left and higher confidence scores at the right. The perfect confidence histogram would show all green bars at the right edge and all red/purple/blue bars on the left.
Refer to our article on Confidence Scores and Thresholds for more information about the Confidence Histogram, and how to use this information.
RTF Histogram
The RTF Histogram displays information about Real Time Factor's when decodes are performed. Visualizing and understanding why decodes are taking a relatively long time to return results can provide significant performance improvements in applications, as well as detect unexpected problems within grammars.

Refer to our article on Slow Decode Tuning for more information about the RTF Histogram and how to use this information.
Call Volume
This is a graph that displays information about your call volume, and the types of interactions, over time.

Right-clicking the graph allows you to toggle different call types on and off.
Clicking and dragging on the call volume graph allows a range of dates to be selected from the total shown. You can then select or exclude any data from these dates.
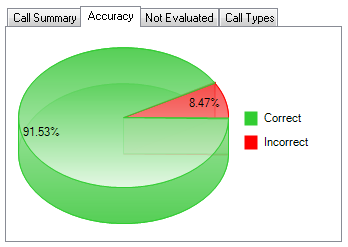
Call Summary, Accuracy, Not Evaluated, and Call Types Tabs
These tabs offer alternate ways display graphs showing different aspects of the data.

Decoded Utterances
A list of all the different recognized utterances from the dataset. Displays the decoded text, the number of times that utterance was said, the accuracy percentage (if transcripts are available), and the average confidence, audio length, and decode time.
Right-clicking the decoded utterances list provides the following options:
Keep Selection
Filters out all interactions that were not recognized as this utterance.
Exclude Selection
Filters out all interactions that were recognized as this utterance.
Sava Data to File...
Allows you to save the list of decoded utterances to a file.
Decoded Semantic Interpretations
Added with LumenVox 13.0, this shows a list of all the different recognized Semantic Interpretations from the dataset. Displays the SI, the number of times that SI was returned, the accuracy percentage (if transcripts are available), and the average confidence, audio length, and decode time.
Right-clicking the decoded semantic interpretations list provides the following options:
Keep Selection
Filters out all interactions that were not recognized as this SI.
Exclude Selection
Filters out all interactions that were recognized as this SI.
Sava Data to File...
Allows you to save the list of decoded semantic interpretations to a file.