Often, when trying to diagnose connectivity issue when working with the LumenVox Media Server, or any application that uses network connectivity to interact with other servers, it can be helpful to check the network traffic that is going between machines.
For example, if one server or application does not respond appropriately to certain requests, it is possible the requests are not being correctly sent, or responses not being correctly received. Looking at the network traffic may be the only way to really determine the root cause of the problem, since log files on both machines may not be correctly representing the problem, or perhaps only describe the symptoms.
In these cases, we recommend using a network packet capture utility, such as the popular command-line tcpdump, Wireshark GUI, or similar utilities.
Please Read The Manual
Utilities that capture network traffic are extremely useful and powerful tools, but should be used with due consideration to their security implications as well as how these tools affect the overall performance of the machine it is being run on. We strongly recommend you read the user manuals when working with such utilities, since such coverage is beyond the scope of this simple article.
Command Line or GUI
The choice of whether to use a command line or GUI version of a packet capture utility is purely up to the individual user. These utilities generally create compatible (pcap format) log files that can be used in exactly the same way. Users often prefer either the command-line approach or the GUI version based on personal preference, or necessity - you may only have access to a command line interface for instance. Whichever utility is used, the packet capture files that they generate are generally the same.
Since these are the same, we will concentrate on using command line examples based on tcpdump here, and allow users to determine how this can be achieved using the GUI or other utilities as needed - there are many online references available for Wireshark and other tools that are beyond the scope of this article.
A Simple Packet Capture
It is possible to start a packet capture using a simple command such as this:
root@host:~# tcpdump -p -n -i eth0 -s0 -w capture.pcap
The parameters used here are described in the following table
|
Parameter
|
Meaning
|
|
-p
|
Don’t put the interface in promiscuous mode
|
|
-n
|
Don’t convert host addresses to names
|
|
-i eth0
|
Use specified interface (eth0 in this example). *Select the appropriate interface you need here.
|
|
-s0
|
Entire (not truncated) packets should be captured
|
|
-w
|
Path and name of the capture file to be saved
|
Table 1 - Simple Packet Capture Parameters
You can leave this running for the period of time needed to capture data. Be aware that if you leave this running for a long time, it is likely to create an extremely large file that may be difficult to work with. Remember to only run a packet capture for only the duration you need. If you require longer-term packet captures to try to diagnose intermittent, or infrequent issues, see the section below that describes Rotating Capture Files.
Interface Considerations
These days, many servers have multiple network interfaces, as well as the loopback interface. Network capture utilities need to be told which interfaces to capture traffic from, so you should take this into consideration when configuring any packet captures. In the example above, the interface specified was eth0, however the interface you need to specify for your own needs may vary.
The Loopback Interface
Note that when you are trying to capture network data between one process to another process within the same machine, you may need to use the loopback interface. This would be the case where you have your telephony platform and LumenVox services all installed on the one server. This type of loopback traffic is typically described as using the special localhost or 127.0.0.1 designations, since the traffic doesn't actually leave the machine, but is routed internally without ever reaching the network.
On Linux systems, this can simply be done by specifying the lo interface (-i lo) as shown in the Simple Packet Capture example above. On Windows based systems, it is not so easy, since capturing such loopback traffic is prevented, although a number of workarounds to this have been documented, such as the one described by the Loopback Capture Setup article on the Wireshark site.
In some cases, it may be easier to set LumenVox up on a second machine, allowing packet capture to be more easily performed and then once the issue has been corrected, move traffic back to the single machine and the original LumenVox installation, if desired.
Analyzing the Data
Once you have packet capture files, you can send these to LumenVox if you are working with the Client Services Team, or you can use a tool like Wireshark to view the contents. Note that this generally requires some familiarity with network traffic, since the contents are quite detailed.
As mentioned above, the analysis of network data that is saved from these network capture utilities is quite involved and is certainly beyond the scope of this article. Please refer to one of the many online articles, such as those on wireshark.org that go into detail about interpreting the information in these files. This is typically performed by a network analyst.
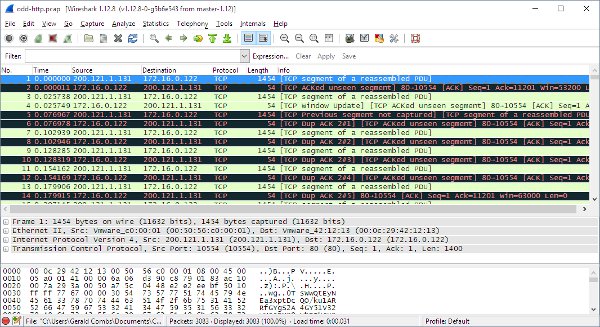
A typical Wireshark view of a packet capture will look something like this example (courtesy of wireshark.org):

Figure 1 - Sample Wireshark screen-shot
Rotating Capture Files
Occasionally, there is a need to capture network traffic over a period of time, to analyze performance or to diagnose an intermittent or infrequent problem. In such cases, is is generally impractical to use the Simple Packet Capture options specified above, since the files generated could be extremely large and difficult to work with.
A better solution is to configure the packet capture utility to utilize a ring-buffer, or circular logging mechanism, where a number of files can be specified, along with the size of each file. When logging in this configuration, whenever the first log file reaches the size limit you specify, the next log file will be started.
Whenever the maximum number of specified log files have been reached, the first log file is overwritten and logging continues. This is a very efficient mechanism, allowing you to limit the maximum number of files and the size of those files used for logging. This can be used to set up a long-term capture without exhausting resources.

Figure 2 - Circular logging mechanism
This circular logging mechanism can be configured using tcpdump (and by extension, GUI based utilities) by adding additional parameters as shown below. Note that all parameters to tcpdump are case sensitive, so please be sure to use the correct case when using them (these two parameters are UPPERCASE).
|
Parameter
|
Meaning
|
|
-C 30
|
Max log file size before moving to next (30 MB
in this example)
|
|
-W 5
|
Max number of log files (5 in this example)
|
Table 2 - Circular Logging Packet Capture Parameters
Using these new parameters, we can start a packet capture that uses up to 5 files, each containing a maximum of 30 MB, in a circular logging configuration using the following command line:
root@host:~# tcpdump -p -n -i eth0 -s0 -C 30 -W 5 -w capture.pcap
After the event you are trying to capture has occurred, you should stop the packet capture to prevent the log files being overwritten. Refer to the Analyzing the Data section above for next steps.
Rotating Log File with Wireshark
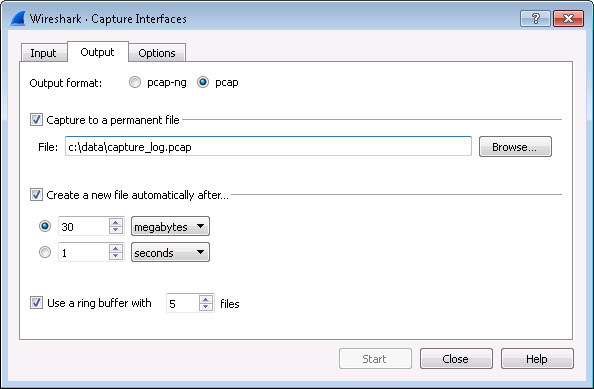
Setting the circular or rotating log mechanism when using the Wireshark utility is not always obvious, so here is an example of how this would be configured after selecting the Options selection from the Capture menu, or using the Ctrl-K keyboard shortcut, then selecting the Output tab.

Figure 3 - Capture Output Options dialog within Wireshark Utility
As you will notice from the settings shown, an output filename is specified after selecting the 'Capture to a permanent file' checkbox is selected. This determines the names and location of the generated files.
The 'Create a new file automatically after...' checkbox should be selected, to enable circular logging, as well as the first radio-button below it to indicate the transition to each new log file should be based on size. You will then need to specify the maximum file size you desire - this is specified as 30 megabytes in the example show.
The 'Use a ring buffer with' checkbox should be selected and the counter to the right of that should be used to specify the maximum number of files to create before overwriting the first, while logging.
These parameters are comparable to the command-line -C and -W parameters described above. After these options are specified, Wireshark can be used to perform a packet capture, logging data to disk with in circular logging fashion, as needed.
Remember to stop the packet capture after the event you are waiting for has occurred, so that data from this event is not eventually overwritten and again, refer to the Analyzing the Data section above for next steps.
Firewall Considerations
When capturing network data, this is typically done from the perspective of the machine that the capture is taken from. It is important to understand that from this perspective, the data may appear different than if it were captured on another machine. For example, there could be a routing problem between the machines, or some firewall rules that block only certain traffic.
Be sure to consider this when performing network packet capture. If there is the possibility of requests or responses being lost between machines, it may be necessary to capture network traffic simultaneously on multiple machines in order to get a clear understanding of why certain packets are not reaching their intended destination.
Packet Capture Filtering
It is possible to configure various filters when capturing network data like this, so that for example only certain types of data are captured, or only data between certain source and destinations are captured. Generally, this type of filtering may not be helpful when performing analysis, since it is easily possible to inadvertently omit important information, which could mask the root cause of problems and for this reason, we generally recommend capturing all data unfiltered.
Types of data that may be useful when reviewing captured logs include SIP, RTSP, MRCP, RTP, HTTP(S) and other traffic, which can appear on a wide number of different ports and addresses, so it is generally a good idea to capture unfiltered data whenever possible. The examples shown above do not implement any filtering.