- Installation
- Administration
- Programmer's Guide
- Grammars
- MRCP Server
- FAQs
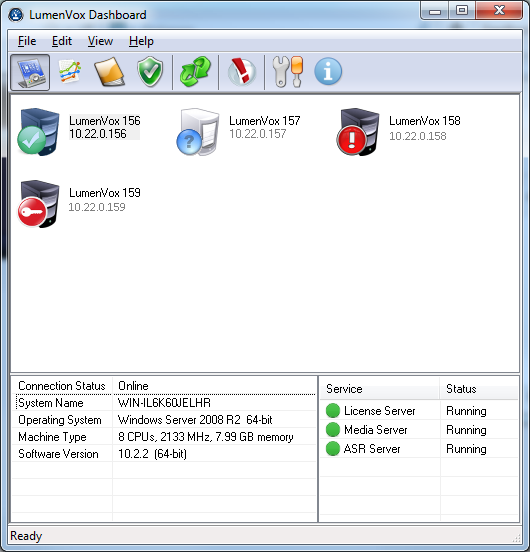
Summary View
The Summary View provides an overall view of the services and machines being monitored by the Dashboard.
Machine List
The upper portion of the view shows all of the machines being monitored by the Dashboard.
Icons are used to indicate each machine's overall state; whether it is currently offline, connected and healthy, or has some sort of problem. These states, and their associated icons are listed below:
![]() Server OK - Online and all services reporting no problems
Server OK - Online and all services reporting no problems
![]() Server Offline - there is no communication between Dashboard and this machines manager
Server Offline - there is no communication between Dashboard and this machines manager
![]() Server Problem - typically a service has stopped responding
Server Problem - typically a service has stopped responding
![]() Server Locked - typically mismatched username/password
Server Locked - typically mismatched username/password
Machines can be added to the list by right-clicking and selecting 'Add Machine' from the popup menu. Once selected, the Add Machine dialog appears, allowing you to specify the settings for the new machine.
After machines have been added to the list, they can be edited and optionally deleted by right-clicking and selecting the appropriate option from the popup menu.
Machine Information List
In the lower left portion of the Summary View, there is a machine information list, which displays information relating to the currently selected machine.
Typically the machine Operating System and basic hardware information is displayed here, along with the software version being reported by the LumenVox Manager installed on the machine.
Services List
The lower right portion of the Summary View shows the list of services being reported for the selected machine, along with their operational status.
A green icon next to a service indicates that the service is operational. Red indicates that the service is not currently running. A yellow icon indicates that the service is in a transitional state - either stopping or starting.
From this services list, you can optionally start or stop these services as needed.